

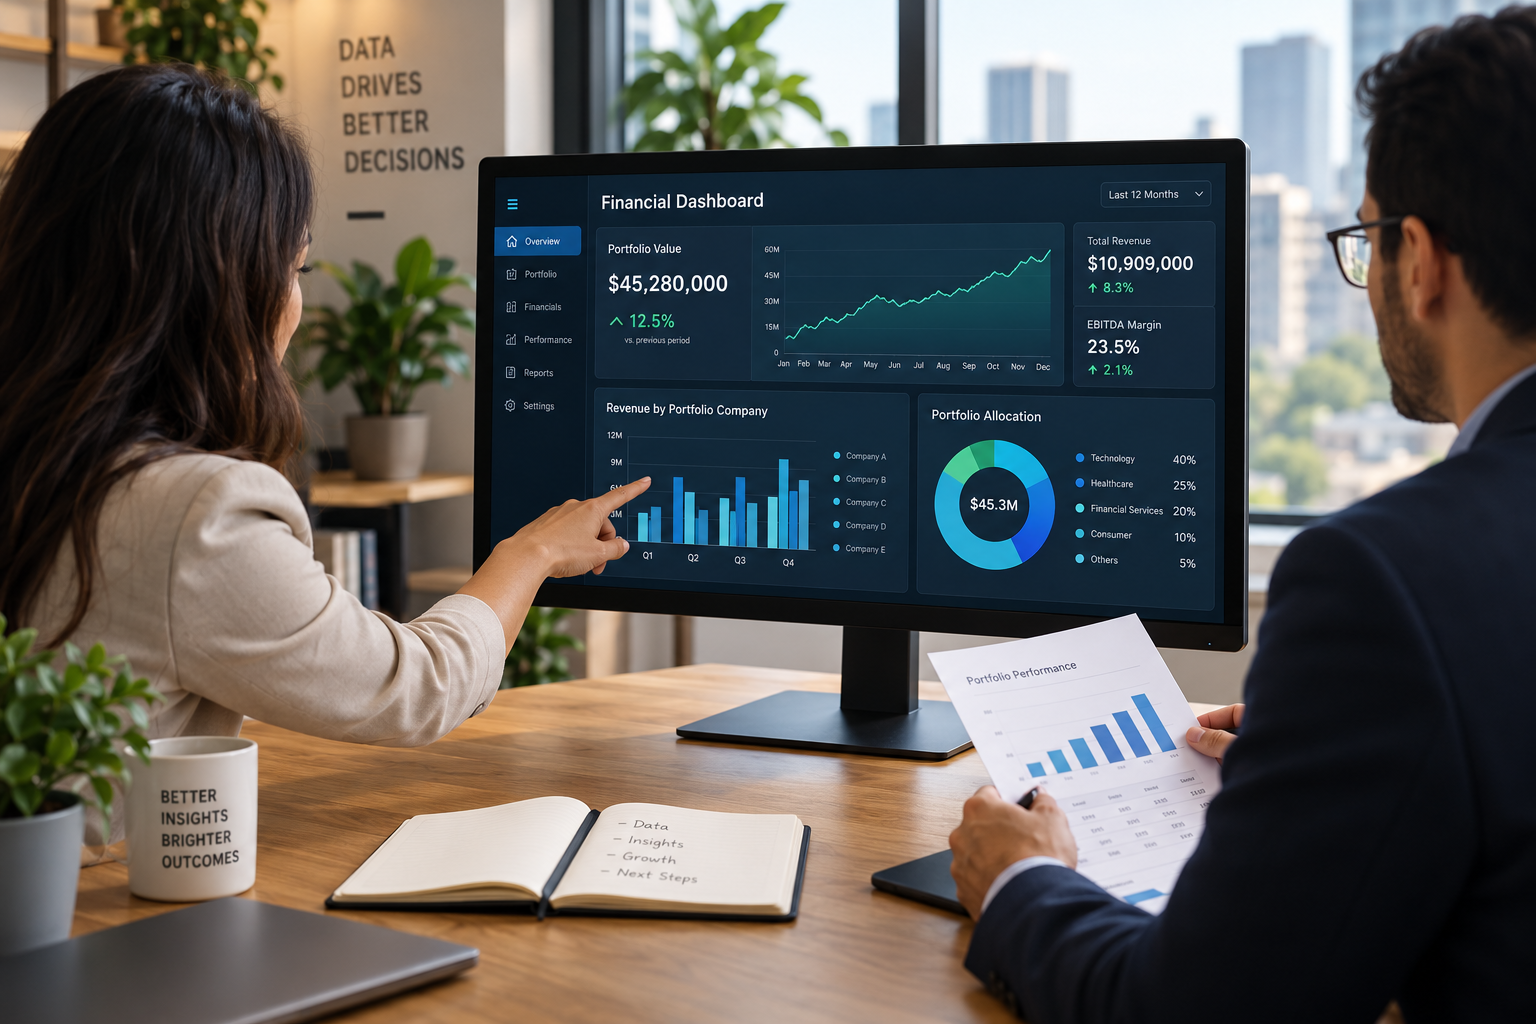

For private equity-backed businesses, leveraging dashboards to drive portfolio value often requires overcoming significant data fragmentation and manual reporting bottlenecks. The immediate operational challenge lies in aggregating disparate financial and operational data quickly enough to satisfy investor demands and identify actionable insights.
This article explores how advanced financial intelligence dashboards can serve as critical instruments for PE-backed entities. It details their application in accelerating value creation, meeting stringent investor reporting requirements, and strategically preparing for a successful exit. These sophisticated tools provide a unified view of performance, moving beyond static reports to dynamic, real-time insights.
Key Architectural Components
Effective financial intelligence systems for private equity operations are built upon a robust architecture designed for data integrity, scalability, and analytical depth. At their core is a unified data model that ingests information from multiple enterprise resource planning (ERP) systems, general ledgers, customer relationship management (CRM) platforms, and operational databases across diverse portfolio companies.
This data lake or data warehouse component acts as a central repository, ensuring consistency and accuracy. A critical layer involves data transformation and enrichment, where raw data is cleaned, mapped to a standardized chart of accounts, and enriched with business context. This prepares the data for advanced analytics and dashboard visualization.
The visualization layer itself comprises configurable dashboards tailored to specific user roles, from portfolio managers and CFOs to individual department heads. These dashboards are not merely static displays but interactive tools, allowing users to drill down into underlying data, apply filters, and conduct ad-hoc analysis. Security and access control are paramount, ensuring that sensitive financial data is only visible to authorized personnel.
Key Deployment Challenges
Implementing a comprehensive dashboard solution within a PE-backed portfolio presents several inherent challenges. A primary hurdle is the heterogeneity of source systems across acquired companies, which often use different ERPs, accounting software, and data structures. This necessitates significant effort in data mapping and standardization to create a cohesive view.
Another challenge is securing executive buy-in and fostering a data-driven culture. Without clear sponsorship and consistent usage by leadership, even the most advanced systems risk underutilization. Training and change management are crucial to ensure that finance teams and operational leaders adopt new workflows and leverage the system’s full capabilities.
The ongoing maintenance and scalability of the solution also pose complexities. As new companies are acquired or existing ones grow, the system must adapt seamlessly to new data sources and increased data volumes without compromising performance or data quality. This requires a flexible architecture and robust data governance frameworks.
| Capability | Traditional | AI System |
| Data Aggregation | Manual, error-prone, weekly/monthly | Automated, real-time, consolidated |
| Data Lineage Tracking | Limited, often undocumented | Full, auditable, versioned history |
| Multi-Entity Consolidation | Time-consuming, spreadsheet-based | Instant, rule-based, intercompany eliminations |
| Audit Readiness | Labor-intensive data preparation | Embedded, automated trail, compliance checks |
| Scenario Modelling | Basic, static, limited variables | Dynamic, multi-dimensional, predictive |
The distinction between traditional reporting and AI-driven financial intelligence systems is profound, particularly in the context of Private Equity. While traditional methods rely heavily on manual data manipulation and static outputs, modern AI-powered platforms automate data ingestion, consolidation, and anomaly detection. This significantly reduces the risk of human error and accelerates the reporting cycle, leading to a 25% faster resolution of critical financial inquiries and a marked improvement in decision confidence.
Scenarios Illustrating Impact
Scenario 1: Accelerating Investor Reporting
Problem: A PE-backed manufacturing company struggled with quarterly investor reporting. Consolidation of financial statements from three distinct subsidiaries, each using different ERP versions, took over two weeks. This led to last-minute rushes, potential data discrepancies, and delayed distribution of critical performance updates to investors, impacting confidence.
Implementation: The company deployed an integrated financial intelligence dashboard system. This system connected directly to each subsidiary’s ERP, automatically extracting and standardizing data daily. Pre-configured consolidation rules and intercompany eliminations were established within the platform.
Measurable Outcome: The time required for quarterly consolidation and report generation was reduced from two weeks to three days, an 80% improvement. Investor reports were consistently delivered ahead of schedule, with increased accuracy and detailed drill-down capabilities for any specific KPI, enhancing transparency and trust.
Scenario 2: Optimizing Operational Performance through KPI Visibility
Problem: A PE-owned retail chain with 50 locations lacked real-time visibility into key operational performance indicators (KPIs) such as average transaction value, inventory turnover, and employee productivity by store. This hindered prompt identification of underperforming locations and prevented agile strategic adjustments.
Implementation: An operational improvement dashboard was implemented, pulling transactional data, inventory levels, and labor costs from the POS and HR systems hourly. Custom visualizations were created to display store-level performance, regional trends, and comparative metrics against benchmarks, accessible to store managers and regional VPs.
Measurable Outcome: Within six months, proactive adjustments based on real-time KPI insights led to a 10% uplift in average transaction value across the lowest-performing stores and a 15% reduction in inventory holding costs due to optimized turnover strategies. Decision-making became data-driven and significantly more responsive.
Before vs. After: The Dashboard Evolution
Before advanced dashboards, reporting speed was often measured in weeks, involving significant manual effort in data extraction and consolidation. Errors were common due to spreadsheet-based manipulations and disparate data sources, leading to a high margin for discrepancies. Decision-making was frequently reactive, relying on stale data, and lacked the granular detail needed for precise strategic interventions.
With the implementation of modern financial intelligence dashboards, reporting speed is dramatically accelerated to hours or days, driven by automated data pipelines and real-time refresh rates. Error reduction is substantial, supported by data validation rules, AI-driven anomaly detection, and a single source of truth for all financial metrics. This empowers proactive decision-making, allowing finance leaders to identify trends, model scenarios, and implement data-backed strategies with confidence and agility.
How NumeriQu Enables This Capability
NumeriQu provides a robust financial intelligence platform designed to address the complex reporting needs of private equity-backed organizations, providing the reporting rigour PE ownership demands without necessitating a large internal finance team. Its core strength lies in its ability to seamlessly ingest and standardize data from a multitude of enterprise systems, including major ERPs like SAP, Oracle, NetSuite, and Microsoft Dynamics, alongside CRM and various operational databases. This comprehensive data ingestion process is managed through a secure, scalable architecture, ensuring data fidelity from source to insight.
Once ingested, NumeriQu’s platform employs sophisticated data processing and AI-driven reconciliation engines to clean, validate, and transform raw data into a unified financial data model. This includes automated intercompany eliminations, currency conversions, and adjustments, drastically reducing manual effort and minimizing error rates. The platform’s AI capabilities extend to anomaly detection, proactively flagging unusual variances in financial trends or operational KPIs that might indicate underlying issues or opportunities.
The output of this rigorous processing is then presented through highly configurable, interactive dashboards tailored for various stakeholders within the PE ecosystem. These dashboards offer real-time visibility into key financial metrics, EBITDA tracking, operational performance, and investor-specific reporting packages. Unlike generic business intelligence (BI) tools, NumeriQu is purpose-built for finance, offering pre-configured financial logic and templates that go beyond simple data visualization. It also stands apart from traditional ERP reporting, which often struggles with multi-entity consolidation and cross-system data integration, providing a consolidated, holistic view that transcends individual system limitations. This comprehensive integration of data, AI processing, and tailored visualization delivers actionable insights that accelerate value creation and streamline investor communications.
High-Performance Dashboard Layout
A high-performance dashboard layout prioritizes clarity, actionability, and visual efficiency. It typically follows a hierarchical structure, beginning with a high-level executive summary of critical KPIs such such as consolidated EBITDA, cash flow, and revenue growth. Beneath this summary, modules break down performance by business unit, geography, or product line.
Key financial intelligence dashboards often feature variance analysis against budget and prior periods, presented with clear visual cues like color-coded indicators. Operational dashboards might highlight specific drivers of cost or revenue, such as customer acquisition cost, conversion rates, or supply chain efficiency metrics. Drill-down capabilities are essential, allowing users to navigate from aggregated views to the underlying transactional data without leaving the dashboard environment.
What Makes This System Different
The fundamental differentiator of advanced financial intelligence systems for private equity lies in their finance-centric design and integrated data governance. Unlike generic BI tools that require extensive customization and data engineering expertise to build financial models, these systems come pre-equipped with financial logic, consolidation rules, and compliance frameworks. They natively understand concepts like intercompany transactions, GAAP/IFRS reporting, and EBITDA adjustments.
Furthermore, these platforms offer comprehensive data lineage tracking and audit logs, ensuring every data point can be traced back to its source, which is critical for audit readiness and investor confidence. The ability to perform complex scenario modeling and what-if analysis directly within the platform, leveraging integrated financial and operational data, moves beyond traditional static budgeting tools into dynamic strategic planning.
Traditional vs Modern Dashboards
Traditional dashboards were often static reports, generated periodically from a single data source, typically an ERP. They provided historical snapshots and required significant manual effort to compile and distribute. Their primary function was to confirm past performance, with limited interactivity or drill-down capabilities. Data latency was high, and errors could persist unnoticed for days or weeks.
Modern financial intelligence dashboards are dynamic, interactive, and often real-time. They aggregate data from multiple disparate sources into a unified view, refreshed continuously. These dashboards are designed for proactive analysis, allowing users to explore trends, identify anomalies, and perform ad-hoc queries. They empower users with self-service analytics, reducing dependence on IT, and provide a comprehensive, current view of financial and operational health, fostering agile decision-making.
Who Should Use This
These advanced dashboard systems are primarily beneficial for CFOs, finance directors, and their teams within PE-backed portfolio companies, as well as investment professionals and operating partners at the private equity firm itself. Any role responsible for financial performance tracking, investor relations, strategic planning, or operational efficiency gains will find immense value.
Additionally, functional leaders in sales, marketing, and operations can leverage tailored dashboards to monitor their specific KPIs and understand their impact on overall financial health. The system is particularly impactful for organizations undergoing rapid growth, frequent acquisitions, or those operating in complex regulatory environments, where timely and accurate financial intelligence is paramount.
Technology Maturity and Enterprise Adoption Timeline
The maturity of financial intelligence dashboard technology for private equity has evolved significantly. Early solutions were often custom-built, requiring extensive IT resources. Today, purpose-built platforms offer configurable, off-the-shelf solutions that accelerate deployment.
Enterprise adoption typically follows a structured timeline. Phase one involves data integration and establishing the core data model, often taking 3-6 months depending on system complexity and data volume. Phase two focuses on dashboard development and initial user training, spanning another 2-4 months. Finally, phase three involves iterative refinement, advanced analytics integration (e.g., predictive modeling), and broader organizational rollout, continuing as an ongoing process.
Key to successful adoption is strong executive sponsorship and a phased approach that allows users to gradually acclimate to new tools and data-driven workflows. Early successes with critical reports can build momentum for wider implementation.
Key Takeaways
- Financial intelligence dashboards are essential for PE-backed businesses to navigate complex data environments.
- They provide real-time visibility into KPIs, enabling proactive value creation and operational improvement.
- Automated data aggregation and AI-driven reconciliation significantly reduce reporting time and error rates.
- Robust architectural components support multi-entity consolidation and audit readiness.
- Successful deployment requires addressing data heterogeneity and fostering a data-driven culture.
FAQs
Q: How do these dashboards specifically support PE investor reporting?
A: They automate the consolidation of financials across portfolio companies and generate customizable reports with auditable data lineage, ensuring timely and accurate compliance with investor requirements and covenants.
Q: Can these systems integrate with all types of ERPs and financial software?
A: Most modern financial intelligence platforms are designed with flexible connectors and APIs to integrate with a wide range of common ERPs, accounting software, and operational systems, though integration complexity can vary.
Q: What is the primary benefit of AI in these financial dashboards?
A: AI primarily automates data reconciliation, performs intelligent anomaly detection to flag inconsistencies, and can power predictive analytics for more accurate forecasting and scenario modeling.
Q: How do these dashboards help in preparing a business for exit?
A: By providing a transparent, consolidated, and rigorously audited view of financial and operational performance, they enhance valuation, demonstrate clear value creation, and streamline the due diligence process for potential buyers.
Q: Is extensive technical expertise required to manage these dashboard systems?
A: While initial setup may require some technical input, modern platforms are increasingly designed for finance users, with intuitive interfaces and self-service capabilities that minimize reliance on IT for ongoing management and report generation.
If your organisation is evaluating scalable operating models,How Private Equity-Backed Businesses Use Dashboards to Drive Portfolio Value may warrant a structured review across cost, governance, and long-term operational resilience.
To explore what that could look like in practice, contact NumeriQu for a consultative discussion.