

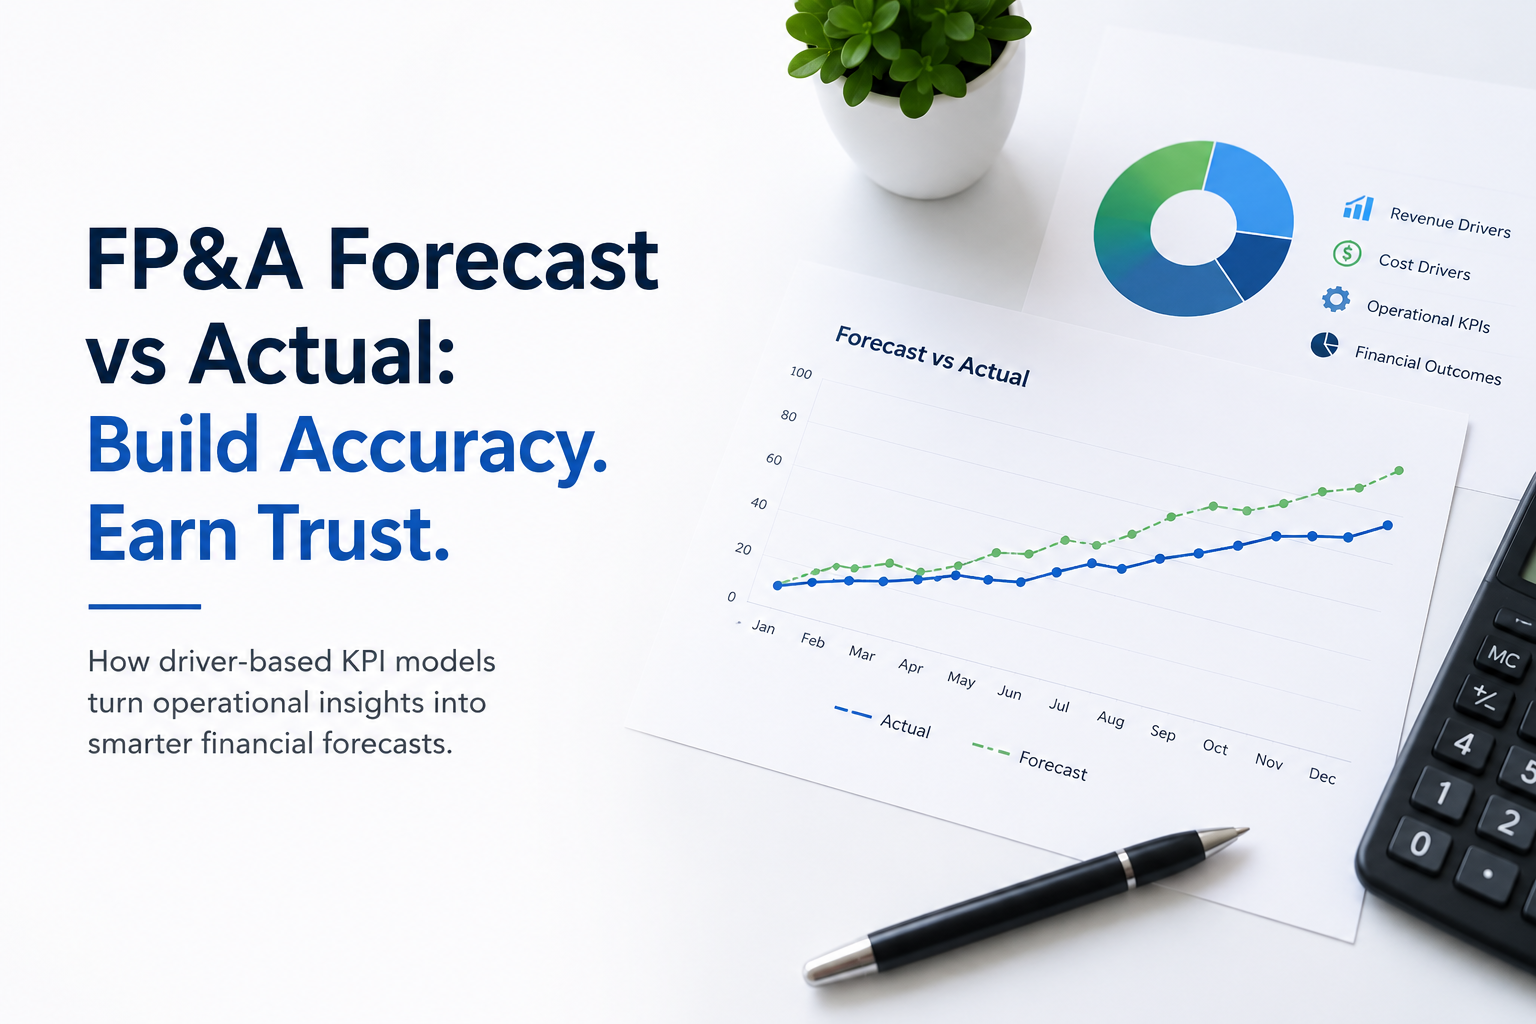

Static, assumption-heavy financial forecasts often fail to accurately reflect operational realities, leading to a significant gap between FP&A forecast vs actual results. This discrepancy erodes leadership confidence and hinders agile decision-making within the enterprise. Our discussion will explore how transitioning to driver-based KPI models can fundamentally improve forecast accuracy and bolster trust in financial projections. A driver-based model links operational inputs directly to financial outcomes, providing a more granular and dynamic view of future performance, crucial for effective financial planning and forecasting.
Traditional financial forecast methodologies frequently rely on historical trends and high-level assumptions, disconnecting them from the granular operational levers that truly drive business performance. This approach leads to a reactive stance, where actuals consistently surprise financial outcomes, undermining strategic planning and resource allocation. The challenge for modern FP&A teams is to establish a direct, traceable link between operational activities and their financial implications.
Driver-based KPI models offer a robust solution by identifying key operational metrics that directly influence financial line items. For instance, in a SaaS business, customer acquisition cost (CAC), churn rate, and average revenue per user (ARPU) are operational drivers that directly impact revenue and profitability. By forecasting these drivers with precision, FP&A teams can construct financial forecasts that are not only more accurate but also explainable and actionable.
Implementing such a model fundamentally shifts the focus from merely reporting numbers to understanding the underlying mechanics of value creation. It enables proactive management of financial outcomes by allowing organisations to manipulate operational levers in anticipation of market changes or strategic objectives. This granular visibility builds a stronger foundation for strategic decisions, bridging the gap between operational strategy and financial performance.
The Limitations of Static Forecasts
Static financial forecasts, often rooted in annual budget cycles and historical extrapolations, suffer from inherent rigidities. They struggle to adapt to sudden market shifts, supply chain disruptions, or rapid changes in consumer behavior. Their core weakness lies in their inability to dynamically incorporate real-time operational data or reflect the interconnectedness of business activities.
Without clear drivers, these forecasts become black boxes. When a variance occurs between the financial forecast and actual performance, identifying the root cause is a time-consuming, manual process involving spreadsheet reconciliation and fragmented data analysis. This diagnostic delay hinders timely corrective action and compounds the erosion of trust in FP&A’s predictive capabilities. Stakeholders become skeptical, viewing forecasts as arbitrary targets rather than strategic compasses.
Furthermore, static models promote a siloed view of the business. Operational teams might manage their KPIs independently, without a clear understanding of their ultimate financial impact. This disconnect prevents unified strategic execution and can lead to sub-optimal resource allocation, as operational investments might not translate directly into desired financial outcomes.
Building a Driver-Based KPI Model
The transition to a driver-based KPI model begins with identifying the primary operational metrics that materially influence key financial outcomes. This requires a collaborative effort across departments—sales, marketing, operations, HR—to map cause-and-effect relationships.
For example, in manufacturing, production volume, material costs per unit, and labor efficiency directly impact cost of goods sold. In retail, foot traffic, conversion rates, and average transaction value drive revenue. Each industry and business model will have its unique set of critical drivers.
Once identified, these drivers must be quantifiable and measurable. Data sources for these operational KPIs need to be integrated and reliable. Establishing clear definitions and consistent tracking mechanisms is paramount for the integrity of the model. This foundational work transforms abstract financial goals into concrete operational targets.
Key Architectural Components
A robust architecture for driver-based forecasting hinges on several interconnected components. At its core is a unified data repository capable of ingesting high-volume data from disparate sources—ERPs, CRMs, HR systems, operational platforms, and external market data feeds. This data lake or warehouse acts as the single source of truth for both operational and financial information.
Beyond data ingestion, the architecture requires a powerful calculation engine that can process complex interdependencies between drivers and financial lines. This engine must support flexible modeling, allowing FP&A teams to define and refine driver relationships, weighting factors, and scenario parameters without extensive IT intervention. An integrated reporting and visualisation layer is also essential, providing dynamic dashboards that present forecast vs actual variances at both the driver and financial KPI levels.
Finally, robust data governance and security protocols are crucial to ensure data quality, compliance, and controlled access. This multi-layered architecture moves beyond simple data aggregation to truly enable dynamic, intelligence-driven financial planning.
Key Deployment Challenges
Deploying a sophisticated driver-based forecasting system presents several challenges. Data integration often tops the list, given the heterogeneity of enterprise systems and the varying quality of data across departments. Reconciling disparate data formats and ensuring data consistency requires significant effort and a clear data strategy.
Another hurdle is organisational change management. Shifting from traditional forecasting methods to a driver-based approach demands new skill sets within FP&A—more analytical prowess, data literacy, and a deeper understanding of operational mechanics. It also requires fostering cross-functional collaboration, breaking down data silos, and aligning incentives across departments. Initial resistance to new processes and technologies is common and must be managed through clear communication and demonstrated value.
Finally, the initial modeling effort for identifying and quantifying drivers can be complex and iterative. It requires deep business knowledge and often an iterative approach to fine-tune the relationships and ensure the model accurately reflects reality. Underestimating any of these challenges can delay adoption and diminish the return on investment.
How NumeriQu Enables This Capability
NumeriQu provides an enterprise-grade platform specifically designed to empower FP&A teams with advanced driver-based forecasting and meticulous forecast vs actual tracking. Its core strength lies in its ability to seamlessly ingest and harmonise vast datasets from across the enterprise, including complex ERP integrations with systems like SAP and Oracle, as well as operational data from CRMs and other bespoke platforms. This eliminates the manual data aggregation that plagues traditional approaches, providing a unified and high-integrity data foundation.
Within Numeriqu, financial models are built directly on these integrated operational drivers. The platform allows FP&A professionals to define intricate relationships between operational KPIs—such as sales pipeline velocity, production yields, or marketing spend—and their direct impact on revenue, cost of goods sold, or operating expenses. This dynamic modeling capability enables scenario planning that is grounded in operational reality, offering immediate insights into how changes in a specific driver will cascade through the entire financial statement.
Furthermore, NumeriQu tracks forecast vs actual performance not just at the aggregate financial level, but granularly down to each individual driver and KPI. Its built-in AI reconciliation and anomaly detection capabilities automatically flag significant variances, identifying whether a discrepancy stems from an underperforming sales team, unexpected material costs, or a shift in customer behavior. This capability moves beyond what generic BI tools or standard ERP reporting can offer, providing prescriptive insights rather than just descriptive data. It provides the ‘why’ behind the variance, enabling faster, more precise interventions and significantly enhancing the confidence in future financial projections by explaining past performance with unparalleled clarity.
Scenarios: Driver-Based Forecasting in Practice
Scenario 1: Optimising Manufacturing Production
Problem: A manufacturing company faced persistent issues with inventory overstocking and production bottlenecks, leading to inconsistent profitability. Their traditional forecasts relied on aggregated sales targets, failing to account for material lead times, machine uptime, or labor availability. This resulted in production plans that were frequently misaligned with actual demand and operational capacity.
Implementation: The FP&A team, in collaboration with operations, identified key drivers: order backlog, raw material costs, production line uptime, and labor hours per unit. They implemented a system to track these operational KPIs in real-time and integrated them into a driver-based financial model. The model directly linked changes in these drivers to forecast cost of goods sold, inventory levels, and ultimately, gross margin.
Measurable Outcome: Within six months, the company reduced inventory holding costs by 20% and improved production efficiency by 15%. The accuracy of their gross margin forecasts improved by 10%, enabling more precise pricing strategies and better capital allocation for raw materials. The tighter integration between operational and financial planning allowed for proactive adjustments to production schedules, preventing both stockouts and overproduction.
Scenario 2: Enhancing SaaS Revenue Predictability
Problem: A rapidly growing SaaS company struggled with volatile revenue forecasts, making it difficult to predict cash flow and plan for scaling infrastructure. Their forecasts were based on high-level subscription growth rates, without accounting for the intricacies of customer acquisition, retention, and expansion. This led to surprises in quarterly earnings and challenges in investor relations.
Implementation: The FP&A department developed a driver-based model using metrics like customer acquisition cost (CAC), churn rate, average revenue per user (ARPU), and sales pipeline conversion rates. Data from their CRM, marketing automation platforms, and subscription billing systems was consolidated. The financial forecast was then dynamically driven by projected changes in these operational KPIs, allowing for detailed ‘what-if’ analysis on the impact of different sales strategies or product features.
Measurable Outcome: The accuracy of their quarterly recurring revenue (ARR) forecasts improved by 12% within the first year. By linking financial outcomes directly to operational drivers, the company gained the ability to anticipate revenue fluctuations and proactively adjust sales and marketing spend. This led to a 25% faster resolution of performance issues and a noticeable increase in investor confidence due to more predictable financial outcomes and transparent reporting.
Before vs After: The Impact of Driver-Based Models
| Capability | Traditional Forecasting | AI-Enhanced Driver-Based System |
| Data Aggregation | Manual, disparate spreadsheets, high error rate | Automated, unified platform, real-time ingestion |
| Data Lineage Tracking | Difficult, opaque, tribal knowledge dependent | Transparent, auditable, drill-down to source |
| Multi-Entity Consolidation | Labor-intensive, prone to reconciliation issues | Automated, robust intercompany eliminations |
| Audit Readiness | Challenging, lengthy, manual documentation | Built-in trails, automated compliance checks |
| Scenario Modelling | Basic, static, limited variables, slow iterations | Dynamic, multi-dimensional, rapid “what-if” analysis |
The stark contrast between traditional and modern driver-based approaches highlights a fundamental shift in FP&A’s operational impact. The AI-enhanced system significantly reduces the time spent on data mechanics, freeing up analysts to focus on strategic insights. This not only improves reporting speed by 30-50% but also drastically reduces error rates by over 40%, leading to a much higher quality of financial intelligence. Decision-making is transformed from reactive guesswork to proactive, data-informed strategy, boosting organisational agility and confidence in financial outcomes.
High-Performance Dashboard Layout and Design
A high-performance dashboard for driver-based forecasting must go beyond mere reporting; it needs to be an interactive analytical tool. Key design principles include a clear hierarchy of information, starting with high-level financial outcomes (e.g., net income, EBITDA) and allowing users to drill down into the contributing operational drivers (e.g., sales conversion rates, production yield). Visualisations should be intuitive, using clear charts for forecast vs actual comparisons, trend analysis, and variance identification.
Critical elements include side-by-side comparisons of planned vs. actual performance for each financial KPI and its underlying drivers, interactive filters for different business units or time periods, and integrated commentary sections for qualitative insights. The layout should facilitate quick identification of anomalies and enable immediate root cause analysis, empowering users to move from “what happened” to “why it happened” in real-time. This dynamic interface is critical for fostering confidence in financial forecasts.
What Makes This System Different from BI Tools and ERP Reporting
While Business Intelligence (BI) tools and ERP reporting provide valuable data insights, they fundamentally differ from a purpose-built driver-based forecasting platform. BI tools are excellent for descriptive analytics—showing “what happened” through dashboards and reports. However, they typically lack the embedded financial intelligence, calculation engines, and driver-based modeling capabilities required for sophisticated predictive and prescriptive analytics.
ERP systems, while being the transactional backbone, offer strong operational reporting but often struggle with the flexibility and agility needed for dynamic financial planning and forecasting. Their reporting modules are usually static, backward-looking, and not designed for complex multi-dimensional modeling or advanced scenario planning. A dedicated driver-based system integrates data from these sources but layers on advanced modeling, simulation, and AI-driven variance analysis that BI and ERP alone cannot provide, enabling a forward-looking, integrated, and highly confident approach to financial planning and forecasting.
Who Should Use This System
Organisations that benefit most from a driver-based forecasting system are those seeking to move beyond reactive financial management to a proactive, insight-driven approach. This includes companies with complex operational models, multiple business units, or rapid growth trajectories where traditional forecasting methods quickly become obsolete. CFOs, FP&A leaders, and finance business partners are primary users, gaining improved forecast accuracy and strategic decision support.
Operational leaders (Heads of Sales, Marketing, Operations) also benefit significantly by seeing the direct financial impact of their departmental KPIs, fostering greater accountability and alignment with overarching financial goals. Essentially, any enterprise striving for greater transparency between operational performance and financial outcomes, aiming to build unshakable confidence in their financial forecasts, stands to gain substantially.
Technology Maturity and Enterprise Adoption Timeline
The underlying technologies for driver-based forecasting—advanced analytics, cloud computing, and AI/ML—have reached a high level of maturity, making sophisticated implementations feasible for enterprises of all sizes. Early adopters, typically larger enterprises with complex data landscapes, began pilots several years ago. Now, with more accessible platforms and refined methodologies, broader enterprise adoption is accelerating.
A typical adoption timeline might involve a 3-6 month discovery and design phase, identifying key drivers and defining integration requirements. The implementation and initial model build-out could take another 6-12 months, depending on data complexity and organisational readiness. Post-implementation, a 3-6 month period of iterative refinement and user training is crucial for full system optimisation and deep user engagement. The benefits, however, often begin to accrue much earlier as initial models yield improved insights and drive more confident decision-making.
Key Takeaways
- Static forecasts are inherently limited by their reliance on historical data and high-level assumptions, leading to significant FP&A forecast vs actual variances.
- Driver-based KPI models directly link operational inputs to financial outcomes, providing a more granular, accurate, and explainable financial forecast.
- Implementing a robust driver-based system requires a unified data architecture, powerful calculation engines, and an intuitive reporting layer.
- Key deployment challenges include data integration complexities and the need for organisational change management to foster cross-functional collaboration.
- Specialised platforms significantly improve forecast accuracy, reduce errors, and enhance decision-making speed compared to generic BI tools or ERP reporting.
FAQs
What is the primary difference between a driver-based forecast and a traditional forecast?
The primary difference is granularity and causality. A driver-based forecast links specific operational metrics (drivers) directly to financial outcomes, explaining the ‘why’ behind the numbers, whereas traditional forecasts often rely on high-level historical trends and broad assumptions, lacking this granular cause-and-effect relationship.
How do driver-based models improve confidence in financial forecasts?
They improve confidence by providing transparency and explainability. When variances occur in the FP&A forecast vs actual analysis, the system can quickly pinpoint which operational driver was responsible, allowing for informed discussions and proactive adjustments, thus building trust among stakeholders.
What kind of data is needed for a driver-based KPI model?
A driver-based KPI model requires a combination of financial data from ERPs, operational data from CRM, HR, and other departmental systems, and potentially external market data. The key is to integrate data related to the specific operational metrics that directly influence financial performance.
Is this type of system only for large enterprises?
While historically adopted by large enterprises, modern cloud-based platforms make driver-based forecasting accessible to mid-market companies as well. Any organisation with complex operations or a strong desire for more accurate and explainable financial predictions can benefit.
What is the typical ROI from implementing a driver-based forecasting system?
Organisations typically see significant ROI through improved forecast accuracy (reducing surprises), operational efficiency gains (e.g., 20-40% reduction in planning cycle time), and better resource allocation. This leads to higher profitability and more agile strategic decision-making.
If your organisation is evaluating scalable operating models, FP&A Forecast vs Actual: Building Confidence with Driver-Based KPIs may warrant a structured review across cost, governance, and long-term operational resilience.
To explore what that could look like in practice, contact NumeriQu for a consultative discussion.